“Good teams judge their seasons by only one metric, wins. Great teams judge their seasons by one game, the Super Bowl. The 2011 Seahawks are neither good nor great, so their season must be judged differently. Eight games into this season, the team is 2-6, but there continue to be reasons for excitement as a Seahawks fan. Players and position groups crucial to the team’s future success are heading in the right direction, some at startlingly fast rates.”
 |
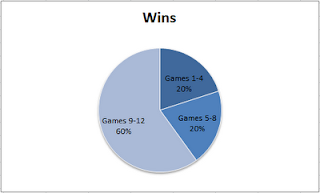
| 60% of the Seahawks wins came in the last four games |
That was the opening for my Midpoint Progress Report and the Quarter-Point Progress Report. The message was there was an underlying strength developing on this team that was not showing up in wins. Yards per carry was steadily increasing, sacks per game was decreasing. The offensive line was developing. Those seeds started sprouting these past four games as the team that had gone 1-3 in each four game stretch before, turned in a 3-1 stretch the past four games.
The offense has led the way in transforming the team. Points scored has jumped from 14.5 in the first four games to 23.5 in the last four. The changes to scoring closely mirror a large change in time of possession. Check it out. First, scoring:
That works out to a 62% increase in scoring comparing the last four games to the first four, and a 37% decrease in opponents scoring. Not bad. Scoring 23.5 points/game would rank 12th in the NFL if they had done it the whole season. Allowing 15.3 would rank 2nd in the NFL. Now, check out how time of possession has mirrored the scoring change:
They look almost identical. The change is smaller in relative terms as the Seahawks have added 29% to their time of possession and reduced their opponents by 20% comparing their first four games to the last four. The Seahawks remain undefeated in the three games they have won the time of possession battle this season. All three of those games came in the last quarter of the season.
Another critical trend has been the swing in turnovers. The Seahawks only forced two turnovers in their first four games. They have forced twelve in the last four. They had surrendered six turnovers in the first four games, giving them a -4 turnover differential. They were still -1 in the second stretch of four games, putting them at -5 for the season. Pete Carroll talks about the importance of the ball. It’s no wonder the team was not winning. Things have flipped dramatically the last four games.
Seattle enjoyed a +9 turnover differential in this last quarter of the season. You want to see a crooked number? The team has forced 500% more turnovers in the last four compared to the first four. Eight of the twelve turnovers have been interceptions. That implies improved play in the secondary, but also more pass pressure. Seattle’s pass rush has not been impressive, but let’s take a look at how their sack numbers have progressed.
It is somewhat surprising to see the average sacks per game has nearly doubled (an 80% jump from the first four games). A 2.25 sack/game average would lead to 36 sacks over the course of a season. That would have ranked right in the middle of the league (14th) last season. Not bad for a team surrendering so much in pass rush at one defensive end position with Red Bryant. The shame of the opponent sack numbers is there could have been even better progress had James Carpenter and John Moffitt not been injured. The line had surrendered two sacks total the two previous games before the injuries. They have surrendered nine in the past three games. Nonetheless, the line has still progressed despite the injuries. Okung’s injury will certainly change that.
More pass rush has likely aided the turnover situation, but Richard Sherman’s insertion into the lineup may be a bigger factor. Turnovers are also a little dependent on luck. No matter the reason, the turnover change has been a major part of the team’s turnaround.
Seattle’s offense has not been producing as many yards despite the increase in points. More turnovers leads to shorter scoring drives. The running game has steadily improved all year, while the passing game has dipped dramatically after Tarvaris Jackson’s injury.
 |
| Seattle’s rushing output has more than doubled , which now accounts for 45% of the offense |
Yardage can be a deceiving statistic. The Seahawks are allowing significantly fewer yards rushing per game, but their yards per carry allowed has sky-rocketed to 4.4 in the last four games, up from 3.2 in the first four and 3.7 in the second four. Teams are getting far fewer possessions due to turnovers and an offense that is holding onto the ball longer. If the Seahawks running game had not taken off, the defense could be getting exposed.
The drop in opponent passing yards, though, is no mirage. Opposing quarterbacks are averaging only 6.0 yards per attempt the last four games, compared to 7.2 in the first quarter and 7.3 in the second quarter of the season. The dip really coincides with Sherman’s introduction into the lineup. Not to mention, the quality of quarterback competition dropped a level or two.
Interestingly, Jackson has seen his yards/attempt sky-rocket even while the passing yardage has dropped precipitously. The team has averaged 7.3 yards/attempt the last four games compare to 5.4 and 6.0 in the first two quarters of the season. Higher point totals, more time of possession, more yards per pass attempt and low number of giveaways paints the picture of an increasingly efficient offense.
The fact that the team has been able to take these steps despite some increasingly critical injuries is impressive. Keep this point of the season in mind since the last four games will be played with 3/5 of the starting offensive line on injured reserve. Who knows what that will look like?
Breaking up the season into quarters is well and good, but as Bill Parcells says, “you are what your record says you are.” Below are the cumulative stats and league ranks of the Seahawks through twelve games. There are some eye-popping changes in just four games.
Summary Stats (Rankings)
Offense
Scoring – 18.0 +2.8 (26th +2, meaning they were 28th after four games and have improved 2 spots in rankings since)
Rushing Yd/Game – 104.1 +15.9 (23rd +7)
Yards Per Carry – 3.9 -0.1 (T22nd -2)
Passing Yd/Game – 194.4 -13.5 (25th -2, meaning they dropped two spots in the rankings)
Yards Per Attempt – 6.8 +0.2 (20th +4)
Sacks – 39 +10 (T31st -1)
QB Rating – 74.8 +3.6 (24th +5)
Turnovers – 19 +4 (13 INT +3, 6 Fumbles +1)
Defense
Opp Scoring – 20.5 -2.6 (13th +9)
Opp Rushing Yd/Game – 103.5 -6.9 (12th +1)
Opp Yards Per Carry – 3.7 +0.3 (T4th -2)
Opp Passing Yd/Game – 236.2 -6.2 (18th no change)
Opp Yards Per Attempt – 7.1 -0.5 (14th +6)
Sacks – 22 +9 (T20th +9)
Opp QB Rating – 80.5 -7.2 (11th +11)
Turnovers Forced – 23 +13 (16 INT +8, Fumbles 7 +5)
Averaging 16 more yards rushing per game while only dropping one-tenth of a yard per carry is great. The sacks will likely continue to rise the rest of the year, and a last place finish there is a real possibility. Look at all that green across defense. Opposing quarterback rating jumped eleven spots in the rankings in four games. Opponent scoring jumped nine spots. Sacks jumped nine spots as well.
Looking Ahead
The Seahawks close with two road games (@CHI, @ARZ) and two home games (STL, SF). All bets are off with the injury situation. Three games against the NFC West provides the chance to finish the season 5-1 in the division. Beating SF would be sweet. Finding continued running success against the Bears and 49ers defense will be tough. Lots of running offenses to face for the Seahawks defense. If the run defense can return to it’s early-season glory, all of the opponents will have trouble scoring. A likely outcome is a 2-2 record and a 7-9 finish. No matter the results, the progress to this point in the season has been remarkable and deserves recognition from the fans. This is a team certainly headed in the right direction.


