
THIS WEEK
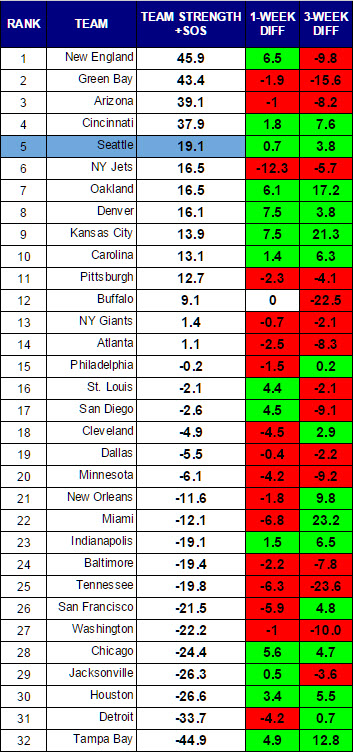
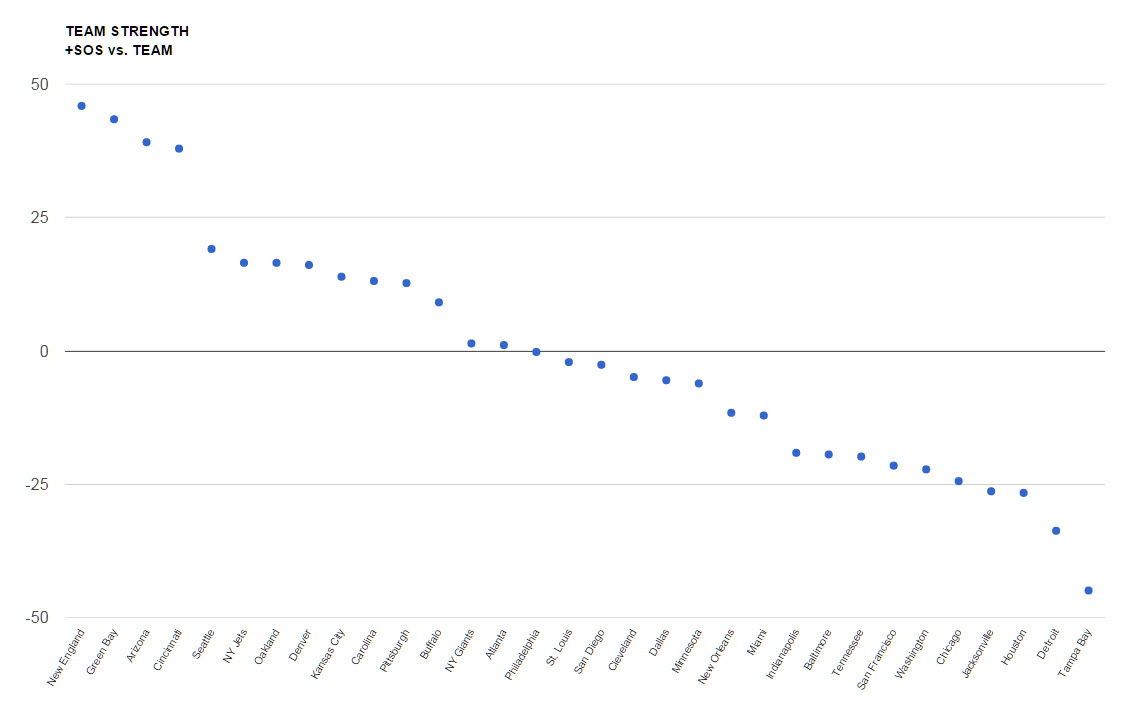
We are halfway through the season, and the teams have started to separate into tiers of strength. There is a clear top four that consists of New England, Green Bay, Arizona, and Cincinnati. There is a second tier from Seattle at #5 to Buffalo at #12. Then, a third tier that consists of the Giants from #13 through Minnesota at #20. You can see all this is the scatter chart below.
The Vikings are an interesting study. They are darkhorse darlings at 5-2, but they have a negative passer rating differential, a flat run differential, and a very shallow point differential. They also have a very weak strength of schedule. My formula considers them a paper tiger.
On the other hand, the Raiders appear to be very real. They have made a steady climb into the top ten, and now sit at #7 overall. Their offense and run defense are terrific. Their pass defense appears to be holding them back.
Denver looked like world beaters Sunday night, but the rankings formula cares about their full body of work. They tied Kansas City for greatest one-week gain in team strength. Their offense will need to continue to improve for their rankings to follow suit.
RANKINGS (WITH SOS)
Scatter
This view helps to give you a view of how teams are grouped together. You will generally see tiers of strength develop as the season wears on.
RANKINGS EXPLAINED
Power rankings are always debatable. I don’t buy into the gut feel methods most places use to determine their rankings, so I developed a formula a few years back that attempts to take at least some of the subjectivity out of the discussion. My approach was simple, I measured offensive and defensive efficiency based on the Yards Per Carry (YPC) and Yards Per Attempt (YPA), as well as points scored and points allowed. The formula to calculate “Team Strength” was as follows:
(YPC (offense) + YPA (offense) + Avg Pts/Game Scored) – (YPC (defense) + YPA (defense)+ Avg Pts/Game Allowed)
The formula has proven to be a pretty accurate predictor of success, but I am always looking for ways to improve it. I read a great article on ColdHardFootballFacts.com. There was one gem in there about predicting championship teams. The article mentioned passer rating differential as the “mother of all stats.” A full 69 of 72 champions have ranked in the Top 10 in this statistic. It is a stat after my own heart, as I believe offensive and defensive efficiency is the key measurable outside of point differential. Turnovers would factor in there as well, but I am not convinced a team has as much control over that. My power rankings use YPA and YPC differentials. I went ahead and replaced the YPA with offensive and defensive passer rating, to give me this:
(YPC (offense) + Passer Rating (offense) + Avg Pts/Game Scored) – (OPP YPC (defense) + OPP Passer Rating (defense)+ OPP Avg Pts/Game)
As of September 23, 2014, I have added a strength of schedule component to the rankings as well.
![]()
