

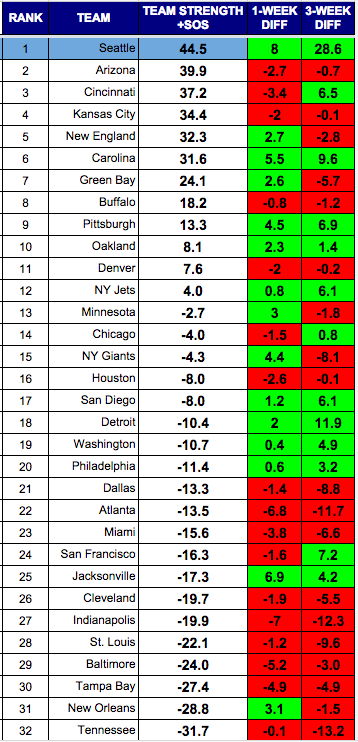
NFC West Takes Over Top Two Spots
If the rankings put a value on consistency, the Cardinals would likely be on top. They have maintained their high level of play throughout the season. The Seahawks benefit from a much tougher strength of schedule than Arizona. That may change over the final three weeks. Both Carolina and Arizona would rank ahead of Seattle if SOS was not part of the equation.
No team is hotter than Seattle, who has gained an astonishing 28.6 points of team strength in the past three weeks. They were 8th in these rankings three weeks ago. If you are wondering how an undefeated Carolina team is ranked 6th, look no further than their 28th ranked SOS. It is not their fault their division is trash, but the rankings formula does not give them pity points for playing weak opponents.
RANKINGS (WITH SOS)
Scatter
This view helps to give you a view of how teams are grouped together. You will generally see tiers of strength develop as the season wears on.

RANKINGS EXPLAINED
Power rankings are always debatable. I don’t buy into the gut feel methods most places use to determine their rankings, so I developed a formula a few years back that attempts to take at least some of the subjectivity out of the discussion. My approach was simple, I measured offensive and defensive efficiency based on the Yards Per Carry (YPC) and Yards Per Attempt (YPA), as well as points scored and points allowed. The formula to calculate “Team Strength” was as follows:
(YPC (offense) + YPA (offense) + Avg Pts/Game Scored) – (YPC (defense) + YPA (defense)+ Avg Pts/Game Allowed)
The formula has proven to be a pretty accurate predictor of success, but I am always looking for ways to improve it. I read a great article on ColdHardFootballFacts.com. There was one gem in there about predicting championship teams. The article mentioned passer rating differential as the “mother of all stats.” A full 69 of 72 champions have ranked in the Top 10 in this statistic. It is a stat after my own heart, as I believe offensive and defensive efficiency is the key measurable outside of point differential. Turnovers would factor in there as well, but I am not convinced a team has as much control over that. My power rankings use YPA and YPC differentials. I went ahead and replaced the YPA with offensive and defensive passer rating, to give me this:
(YPC (offense) + Passer Rating (offense) + Avg Pts/Game Scored) – (OPP YPC (defense) + OPP Passer Rating (defense)+ OPP Avg Pts/Game)
As of September 23, 2014, I have added a strength of schedule component to the rankings as well.
![]()
