POWER RANKINGS
The story this week is undoubtedly the rise of the Seattle Seahawks. They continued their journey through the stage five rapids of their schedule by taking on the top team in the rankings and beating them handily from a statistical perspective. Only a red zone efficiency disparity kept this game from being a resounding Seahawks victory.
- #3 Atlanta (W 26-24)
- #8 @ Arizona (T 6-6)
- #6 @ New Orleans (L 25-20)
- #9 Buffalo (W 31-25)
- #1 @ New England (W 31-24)
- #11 Philadelphia
No team really came close to New England in the rankings leading up to this game. Seattle has now faced five straight top ten teams and are 3-1-1 in that stretch. People ripped them for losing to what was believed to be a lowly New Orleans team at the time, but that squad has been incredibly tough since facing Kansas City the week before playing Seattle. If not for a crazy extra point block and return, the Saints would have beat the Broncos is a fashion very similar to the way they beat the Seahawks. The rankings do not care what your record is. They look at your underlying efficiency on offense and defense, and throw in who you have played to compile those numbers.
Seattle has now also faced the 4th toughest schedule in the NFL, which helps boost their numbers further.
Dallas is always the controversial team in these rankings as they get a huge road win in Pittsburgh, but still rank just 10th here. It has troubled me as well. Enough so, that I have started working on an adjustment to the rankings that puts greater value on run offense and defense. Even before this anomaly, I have been dissatisfied with the ineffectual nature of how rushing is accounted for in the formula. Starting next week, I will share the adjusted rankings and what I changed in the formula to get it. I will likely also continue to share the existing formula rankings for at least three weeks so people can compare and contrast.
In the meantime, Dallas does climb, and is helped a bit by increasing their strength of schedule (SOS) so it is no longer the worst in the NFL. The Steelers are not exactly the powerhouse opponent to use as a measuring stick, though. Their defense is bottom-third of the league.
Rankings
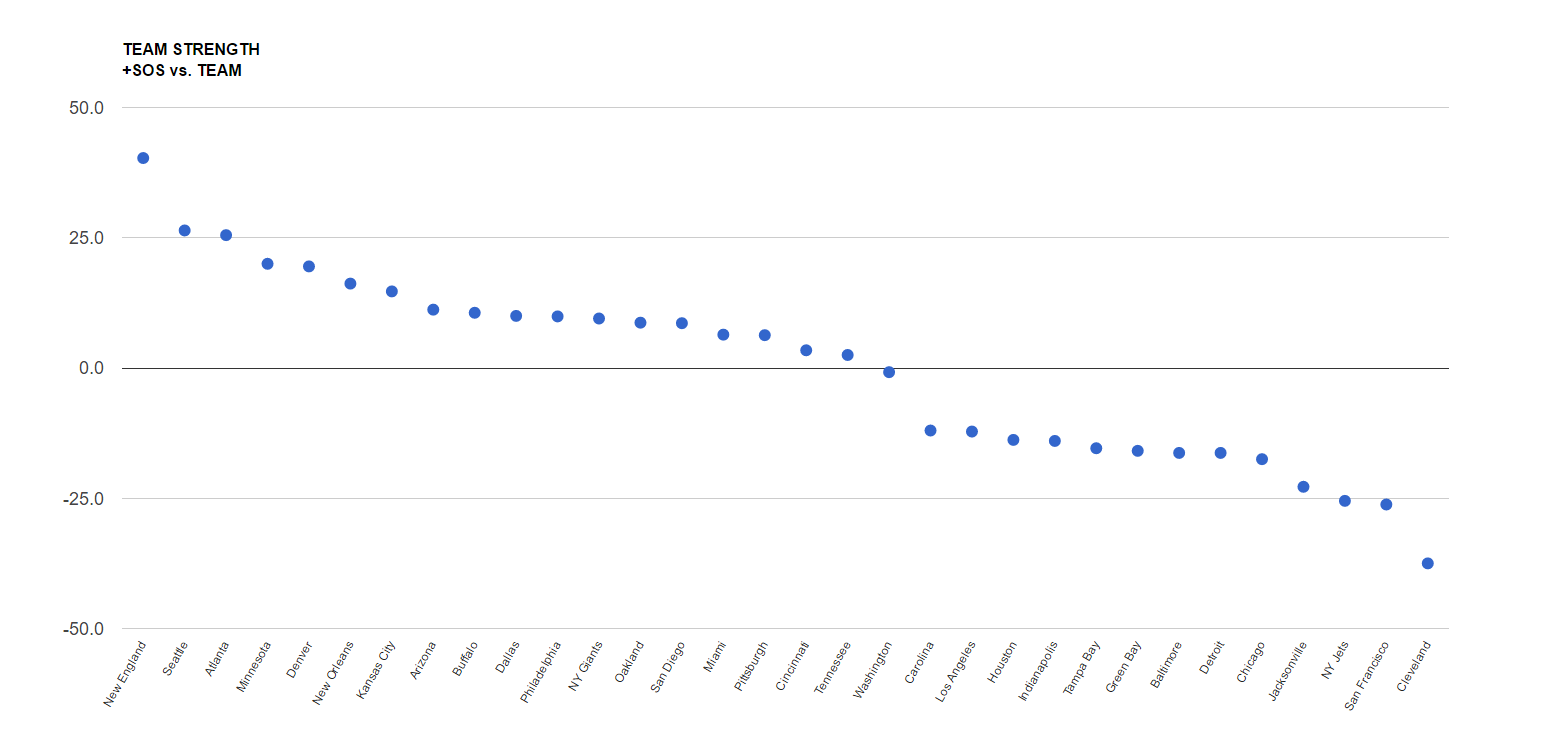
Scatter chart
I like this view as it shows tiers of strength that develop over the course of the season.
RANKINGS EXPLAINED
Power rankings are always debatable. I don’t buy into the gut feel methods most places use to determine their rankings, so I developed a formula a few years back that attempts to take at least some of the subjectivity out of the discussion. My approach was simple, I measured offensive and defensive efficiency based on the Yards Per Carry (YPC) and Yards Per Attempt (YPA), as well as points scored and points allowed. The formula to calculate “Team Strength” was as follows:
(YPC (offense) + YPA (offense) + Avg Pts/Game Scored) – (YPC (defense) + YPA (defense)+ Avg Pts/Game Allowed)
The formula has proven to be a pretty accurate predictor of success (roughly 70% of the teams ranked in the Top 10 by week 3 make the playoffs), but I am always looking for ways to improve it. I read a great article on ColdHardFootballFacts.com. There was one gem in there about predicting championship teams. The article mentioned passer rating differential as the “mother of all stats.” A full 69 of 72 champions have ranked in the Top 10 in this statistic. It is a stat after my own heart, as I believe offensive and defensive efficiency is the key measurable outside of point differential. Turnovers would factor in there as well, but I am not convinced a team has as much control over that. My power rankings use YPA and YPC differentials. I went ahead and replaced the YPA with offensive and defensive passer rating, to give me this:
(YPC (offense) + Passer Rating (offense) + Avg Pts/Game Scored) – (OPP YPC (defense) + OPP Passer Rating (defense)+ OPP Avg Pts/Game)


