POWER RANKINGS
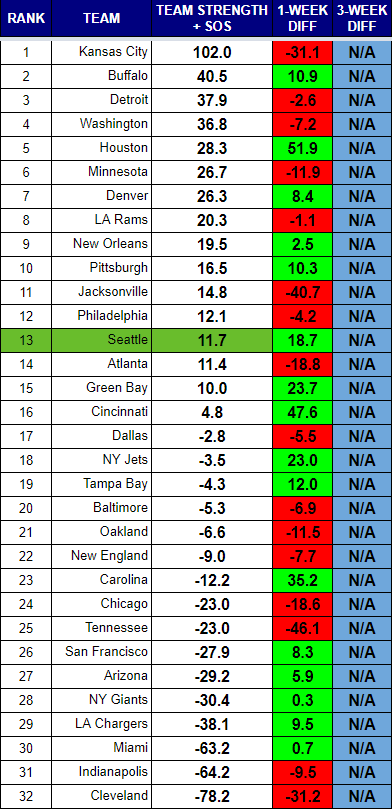
Well, well, well, here we are four weeks into the NFL season and nothing looks as expected. The Chiefs continue to be the class of the league, and it’s not close. Armed with the most efficient passing game, the most efficient running game, and one of the best defenses, the Chiefs appear to have everything they need for an extended run.
How on Earth the Bills wind up in the second spot is one of the fun surprises. They boast the best defense in the NFL by a decent margin, and showed that was for real as then went into Atlanta and beat the undefeated Falcons. Their offense is mediocre, but Tyrod Taylor’s ability to minimize turnovers has been enough to make them dangerous.
The Lions are another team to watch as the quality of their defense is unexpected. Allowing just a 71.6 passer rating to opponents and 17.5 points per game makes them a formidable opponent to the Packers in that division.
Washington went into Kansas City and nearly beat the Chiefs. Their strength of schedule (SOS) has been tough thus far, and their underlying measurables indicate this is a team that could make life tough for the Cowboys and Eagles. They currently have the best offense, the best defense, and the toughest SOS in the NFC East.
Houston should be 3-1. They blew a game in New England, and are arguably the most unpredictable team in the league. Nobody knows what DeShaun Watson is capable of. The defense, which was supposed to be their strength, has been uneven. With a win over the Titans, and a loss to the Jaguars, that division is now up in the air.
The Rams and Seahawks face off this week. Los Angeles boasts the second-best offense and a suspect defense. Seattle has an improving offense and a better defense. Seattle jumped six spots in the rankings after their big win over the Colts. Their SOS took a hit due to the Titans performance and Colts overall suckage. No team has had an easier schedule so far than the Rams, per SOS.
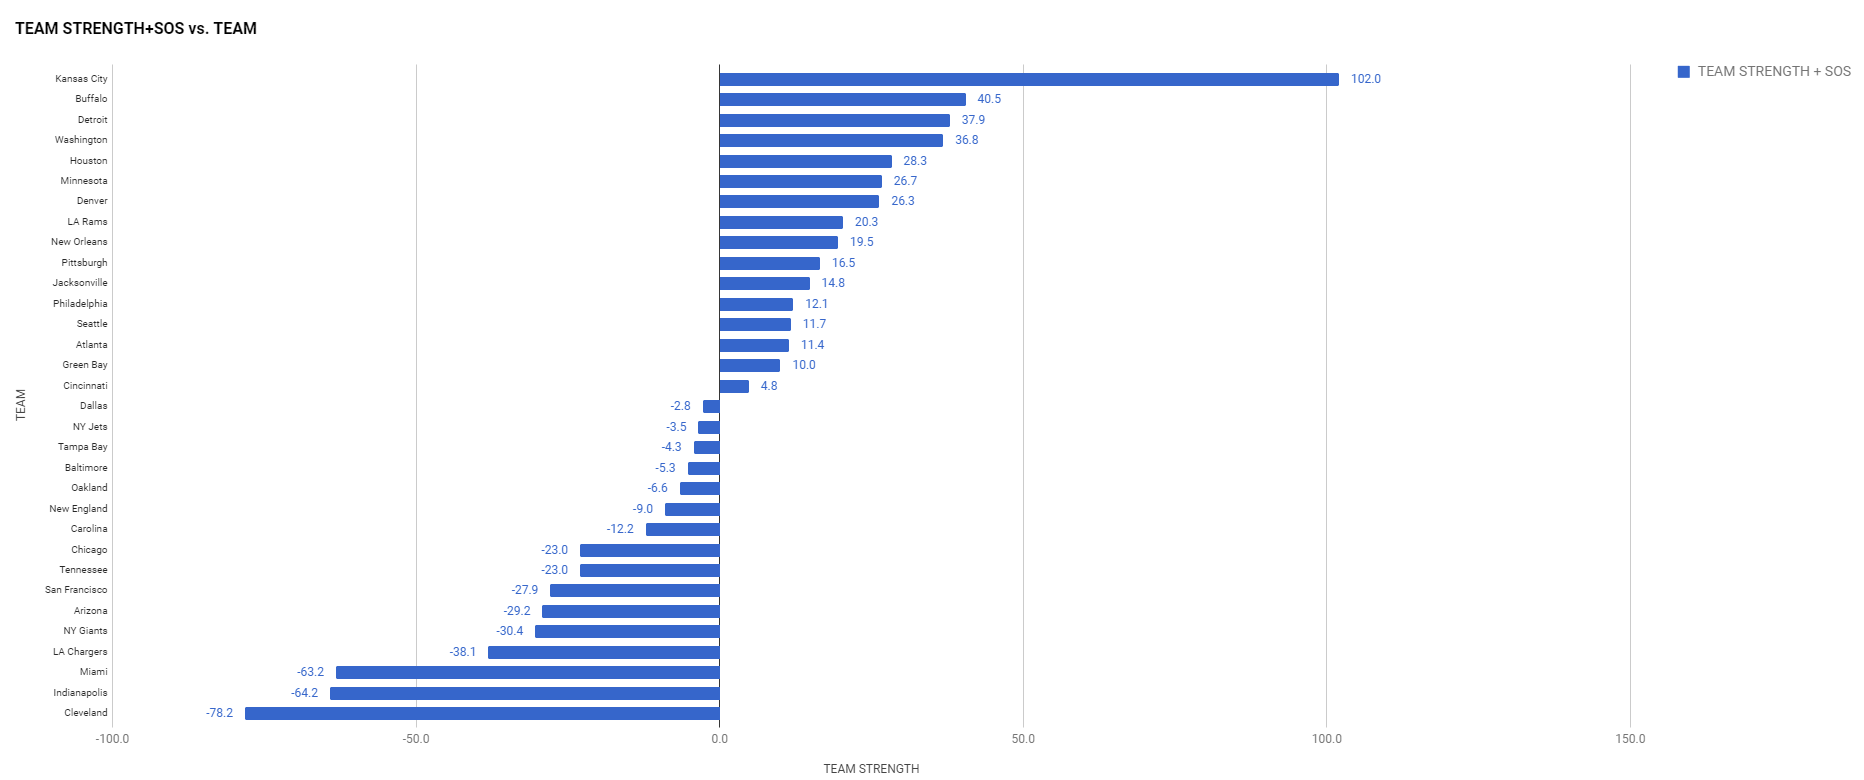
Rankings Visualization
I like this view as it shows tiers of strength that develop over the course of the season.
RANKINGS EXPLAINED
Power rankings are always debatable. I don’t buy into the gut feel methods most places use to determine their rankings, so I developed a formula a few years back that attempts to take at least some of the subjectivity out of the discussion. My approach was simple, I measured offensive and defensive efficiency based on the Yards Per Carry (YPC) and Yards Per Attempt (YPA), as well as points scored and points allowed. The formula to calculate “Team Strength” was as follows:
(YPC (offense) + YPA (offense) + Avg Pts/Game Scored) – (YPC (defense) + YPA (defense)+ Avg Pts/Game Allowed)
The formula has proven to be a pretty accurate predictor of success (roughly 70% of the teams ranked in the Top 10 by week 3 make the playoffs), but I am always looking for ways to improve it. I read a great article on ColdHardFootballFacts.com. There was one gem in there about predicting championship teams. The article mentioned passer rating differential as the “mother of all stats.” A full 69 of 72 champions have ranked in the Top 10 in this statistic. It is a stat after my own heart, as I believe offensive and defensive efficiency is the key measurable outside of point differential. Turnovers would factor in there as well, but I am not convinced a team has as much control over that. My power rankings use YPA and YPC differentials. I went ahead and replaced the YPA with offensive and defensive passer rating, to give me this:
(YPC (offense) + Passer Rating (offense) + Avg Pts/Game Scored) – (OPP YPC (defense) + OPP Passer Rating (defense)+ OPP Avg Pts/Game)


