POWER RANKINGS
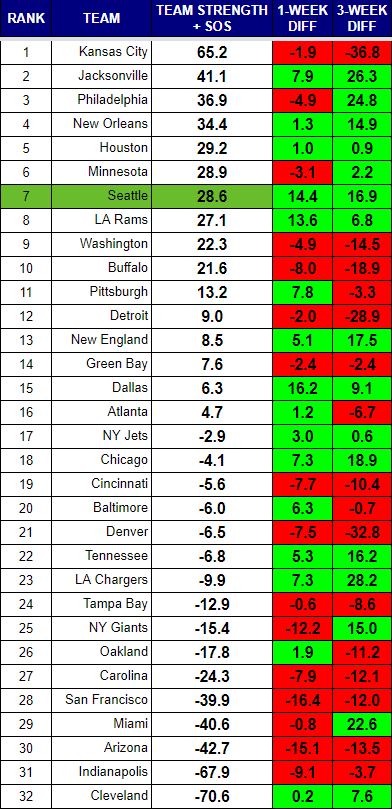
Seattle started the season ranked 19th, and few Seahawks fans were arguing. They remained mired in mediocrity for weeks before slowly beginning their march. Their statistically dominant win over the Giants has them firmly in the top ten almost halfway through the season. The Seahawks and Vikings are remarkably similar teams sitting right next to one another in the rankings. Both offenses are middling. Both defense are elite. The Seahawks have a big advantage in pass defense with a 69.9 opponent passer rating versus 83.0 for the Vikings opponents, but the opposite is true in defending the run where Minnesota has held runners to 3.2 YPC verus 4.7 for Seattle. The Seahawks would appear better positioned to improve with their quarterback and running back options, but a return of Teddy Bridgewater could really shake up the NFC.
Seattle welcomes a top five opponent into town this week DeShaun Watson and the Texans make the trip north. Houston actually has a lower net rating than the Seahawks, but their stronger strength of schedule (SOS) gives them a higher overall rating. The Texans offense is on par with teams like New Orleans, Philadelphia, New England, and Dallas. Kansas City’s offense continues to outshine all others.
The Jaguars sit in the second spot on the strength of their stellar defense. Although, it is worth noting they are struggling to defend the run, allowing 5.2 yards per carry to opponents. The Eagles have been good at defending the run (3.8 YPC), but pretty terrible against the pass (89.1 passer rating). At the risk of being repetitive, every team has at least one glaring flaw. Even the Chiefs are allowing 23 points per game, an 88.5 passer rating, and 4.7 YPC on defense.
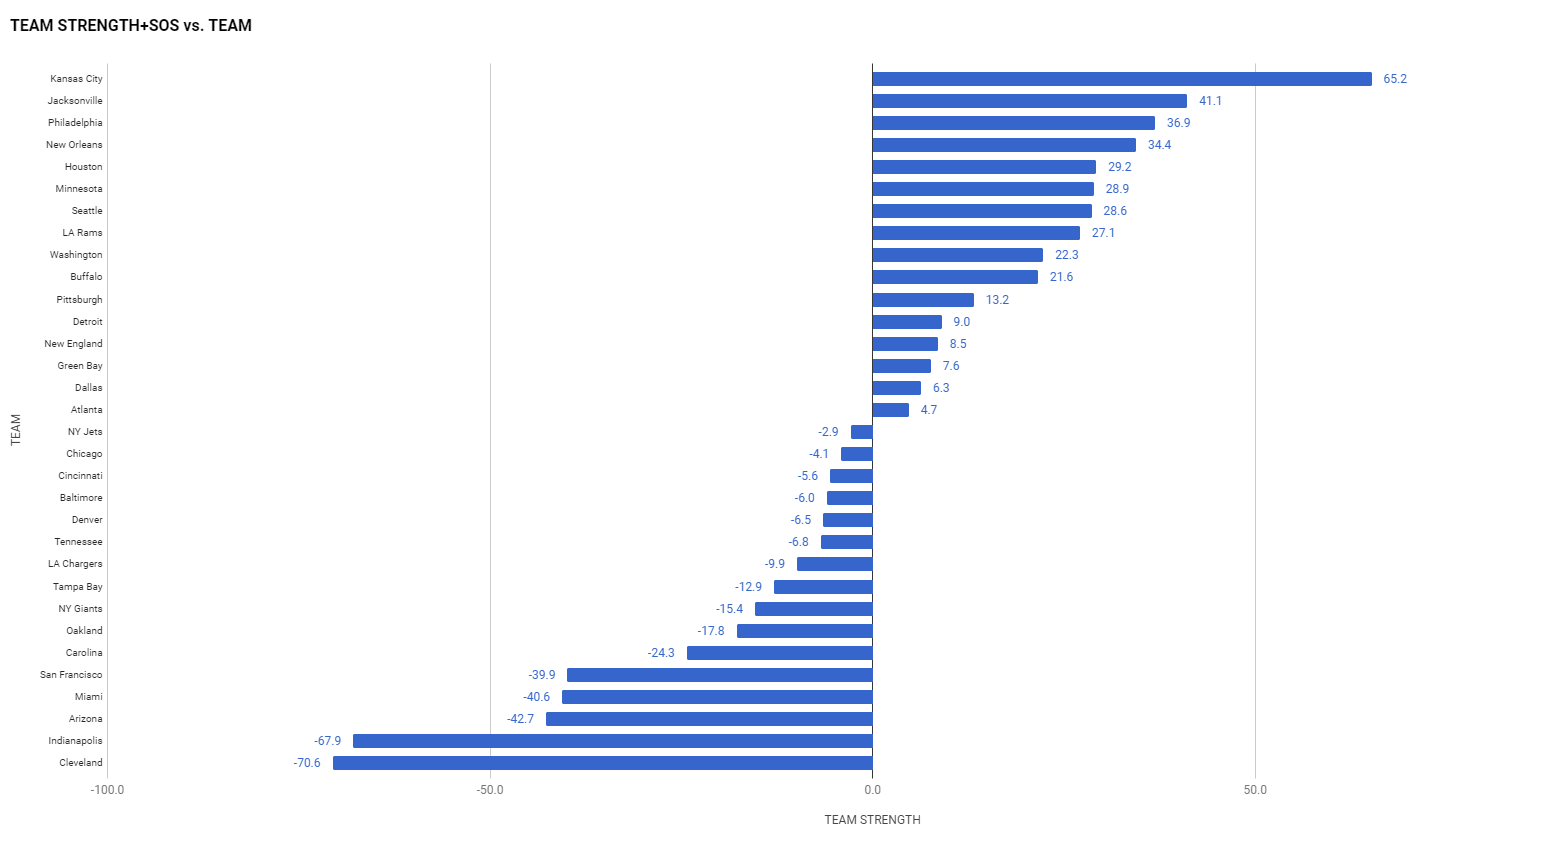
Rankings Visualization
This view shows tiers of strength that develop over the course of the season.
RANKINGS EXPLAINED
Power rankings are always debatable. I don’t buy into the gut feel methods most places use to determine their rankings, so I developed a formula a few years back that attempts to take at least some of the subjectivity out of the discussion. My approach was simple, I measured offensive and defensive efficiency based on the Yards Per Carry (YPC) and Yards Per Attempt (YPA), as well as points scored and points allowed. The formula to calculate “Team Strength” was as follows:
(YPC (offense) + YPA (offense) + Avg Pts/Game Scored) – (YPC (defense) + YPA (defense)+ Avg Pts/Game Allowed)
The formula has proven to be a pretty accurate predictor of success (roughly 70% of the teams ranked in the Top 10 by week 3 make the playoffs), but I am always looking for ways to improve it. I read a great article on ColdHardFootballFacts.com. There was one gem in there about predicting championship teams. The article mentioned passer rating differential as the “mother of all stats.” A full 69 of 72 champions have ranked in the Top 10 in this statistic. It is a stat after my own heart, as I believe offensive and defensive efficiency is the key measurable outside of point differential. Turnovers would factor in there as well, but I am not convinced a team has as much control over that. My power rankings use YPA and YPC differentials. I went ahead and replaced the YPA with offensive and defensive passer rating, to give me this:
(YPC (offense) + Passer Rating (offense) + Avg Pts/Game Scored) – (OPP YPC (defense) + OPP Passer Rating (defense)+ OPP Avg Pts/Game)


