POWER RANKINGS
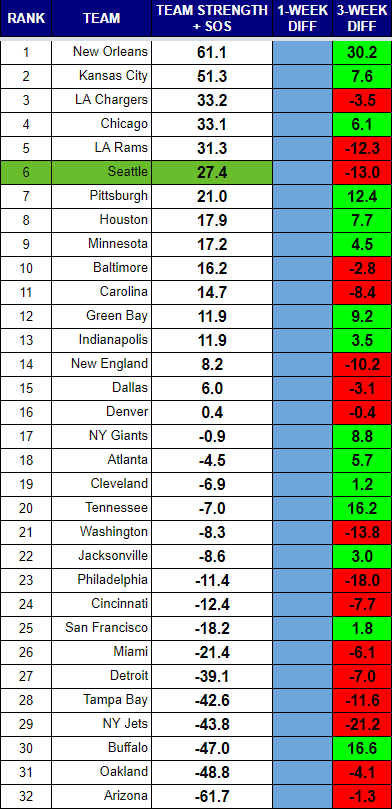
This season feels like the NFL going through a metamorphosis. Offenses are putting up huge numbers, with passing leading the way. The Chiefs game against the Rams was emblematic of this new age of football where defenses were more about having one or two dominant players who can make impact plays than a group of players capable of stopping the opponent with any regularity. It should come as no surprise that Pete Carroll is going the total opposite direction. His team is setting franchise rushing records with the most consecutive games of over 150 yards on the ground. His defense is not very good, but you can be certain the team’s top priority in the offseason will be finding reinforcements on that side of the ball.
Chicago is the other outlier, with a stronger defense than offense. Both the Seahawks and the Bears are going against the grain and find themselves among the top six teams in this weeks rankings.
Of Seattle’s five losses, four of them have come against teams ranked in the top five. None of those losses were by more than a score.
Seattle plays one more game against the top five, and two games total against the top ten. The Seahawks travel to Carolina this week to take on a Panther’s team that is struggling the past two weeks. The Panthers profile as a better team than the Packers, who the Seahawks beat by just three points, and will be at home.
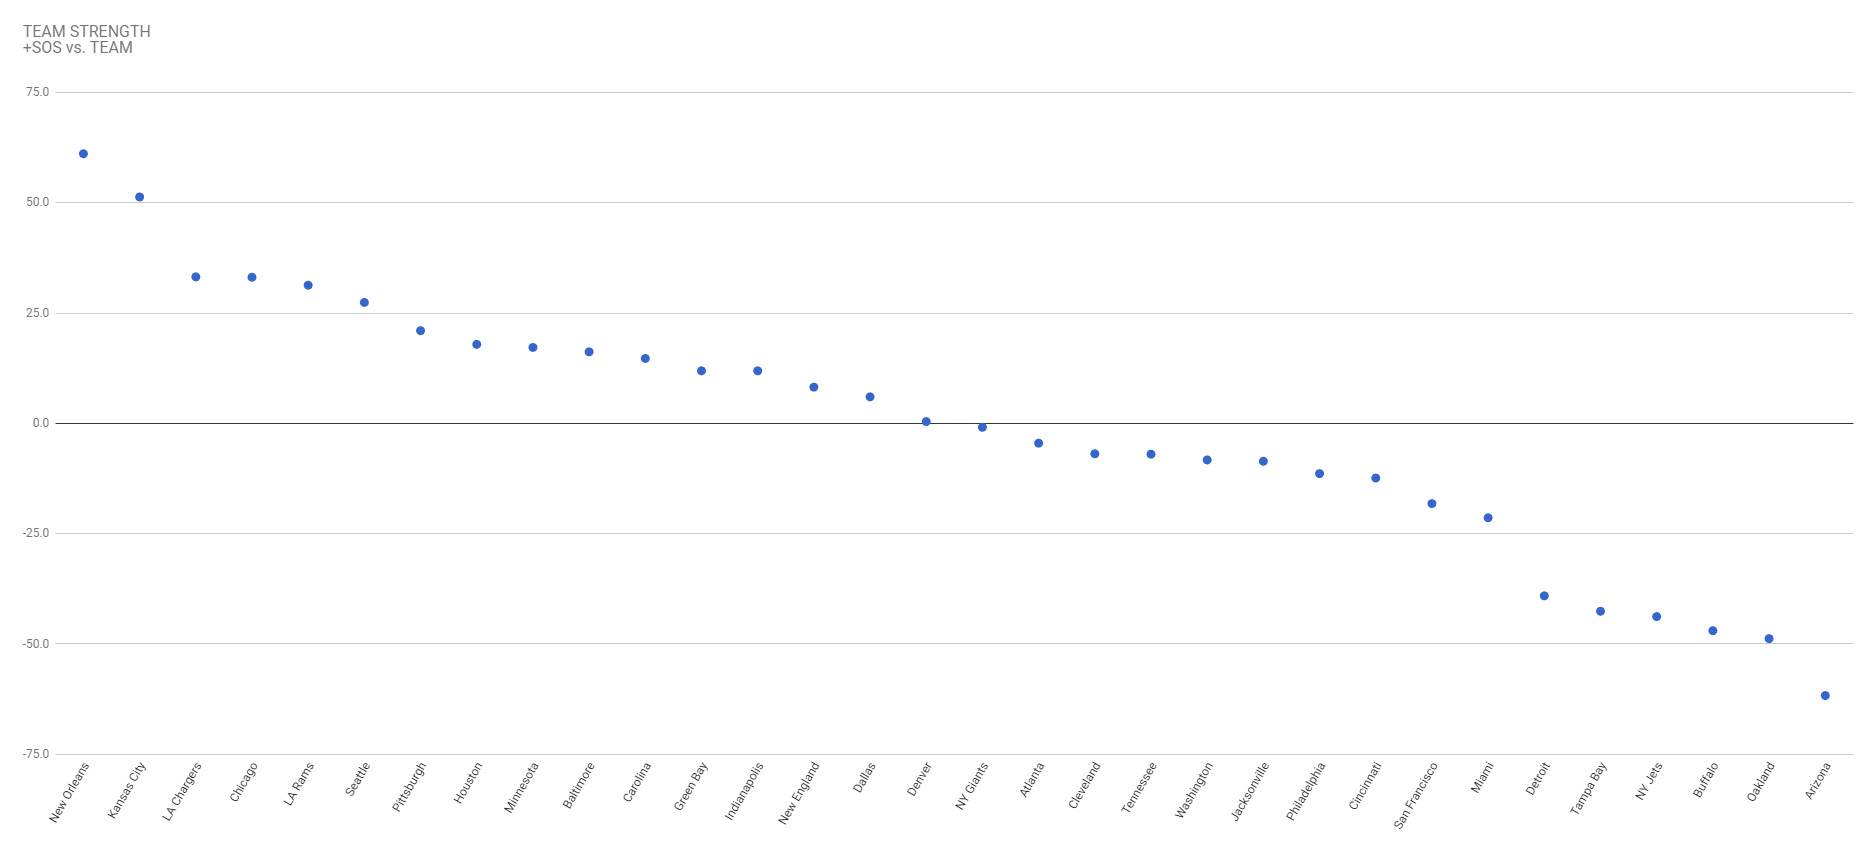
Rankings Visualization
This view shows tiers of strength that develop over the course of the season.
RANKINGS EXPLAINED
Power rankings are always debatable. I don’t buy into the gut feel methods most places use to determine their rankings, so I developed a formula a few years back that attempts to take at least some of the subjectivity out of the discussion. My approach was simple, I measured offensive and defensive efficiency based on the Yards Per Carry (YPC) and Yards Per Attempt (YPA), as well as points scored and points allowed. The formula to calculate “Team Strength” was as follows:
(YPC (offense) + YPA (offense) + Avg Pts/Game Scored) – (YPC (defense) + YPA (defense)+ Avg Pts/Game Allowed)
The formula has proven to be a pretty accurate predictor of success (roughly 70% of the teams ranked in the Top 10 by week 3 make the playoffs), but I am always looking for ways to improve it. I read a great article on ColdHardFootballFacts.com. There was one gem in there about predicting championship teams. The article mentioned passer rating differential as the “mother of all stats.” A full 69 of 72 champions have ranked in the Top 10 in this statistic. It is a stat after my own heart, as I believe offensive and defensive efficiency is the key measurable outside of point differential. Turnovers would factor in there as well, but I am not convinced a team has as much control over that. My power rankings use YPA and YPC differentials. I went ahead and replaced the YPA with offensive and defensive passer rating, to give me this:
(YPC (offense) + Passer Rating (offense) + Avg Pts/Game Scored) – (OPP YPC (defense) + OPP Passer Rating (defense)+ OPP Avg Pts/Game)


