
In a time where advanced statistics are being used in sports coverage more than ever before, EPA (expected points added) has risen as one of the most commonly used metrics to quantify NFL offenses, and in particular, the quarterbacks leading those offenses. If you’re unfamiliar with the concept of expected points, this article is a great introduction: https://www.nfeloapp.com/analysis/expected-points-added-epa-nfl/
The main idea: EPA per dropback is a better measure of QB contribution to the offense than more traditional metrics like passer rating or yards per pass.
I’ve been wondering how EPA can be best utilized to predict QB performance in the upcoming season. In the analysis discussed below, I synthesized quarterback EPA data from the last 10 years and examined the correlations that exist between their numbers in a given season and those same numbers in the next season. To reduce as much noise as possible, I only included regular season games and eliminated any QB kneels, QB spikes, or plays with penalties. Quarterbacks were included in this analysis if they played consecutive seasons with the same team and took at least 300 snaps in each of those seasons. Why 300 snaps? Well, quite simply, in any given season there are roughly 30 quarterbacks to play at least 300 snaps, which essentially leaves us with a dataset comprised of only the starters in the NFL.
Now that the scene is set, let us consider 4 different ways of looking at a quarterback’s EPA over the course of a season…
Mean EPA (average EPA): efficiency
Success Rate (% of EPA>0): consistency
Median EPA: efficiency and consistency
Total EPA: availability and contribution
For each of these statistics, I calculated an R-squared value for the quarterbacks’ EPA from one season to the next. R-squared is a measure of correlation; a value of 1.0 represents perfect correlation (e.g., if every NFL QB had the same exact EPA in consecutive years), and a value of 0.0 represents no correlation at all (what you would get if you were looking at completely unrelated variables, like QB EPA in 2016 and QB hair follicle count in 2017). My goal was to find which statistics provided the highest R-squared value from year to year, and therefore which statistics are most predictive of QB success in the upcoming season. When dealing with these types of analyses, it is important to remember that a very good R-squared would be something like 0.50, where half of all the variability in the data can be explained by the statistic in question. EPA traditionally hovers around 0.40, and others types of metrics often fall in the 0.20-0.30 range. Here are the results for the four EPA statistics I examined:
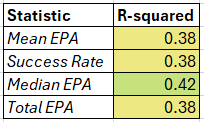
It seems that the median EPA (not the mean, as one might expect) is a little bit more predictive than the others. However, I wasn’t satisfied with this result alone. I also wanted to see how filtering out “garbage time” plays might be able to improve the year-over-year correlation for any of these statistics. To do this, I looked at a “Predictive R-squared” for the correlation between the filtered statistic and the original statistic, as well as a “Stable R-squared” for the correlation between the filtered statistic and itself. Remember, we are comparing QB stats in consecutive years and trying to maximize the correlation to be predictive of any given upcoming season. Here are the R-squared values for different definitions of “garbage time” depending on where you place the win probability cutoff:
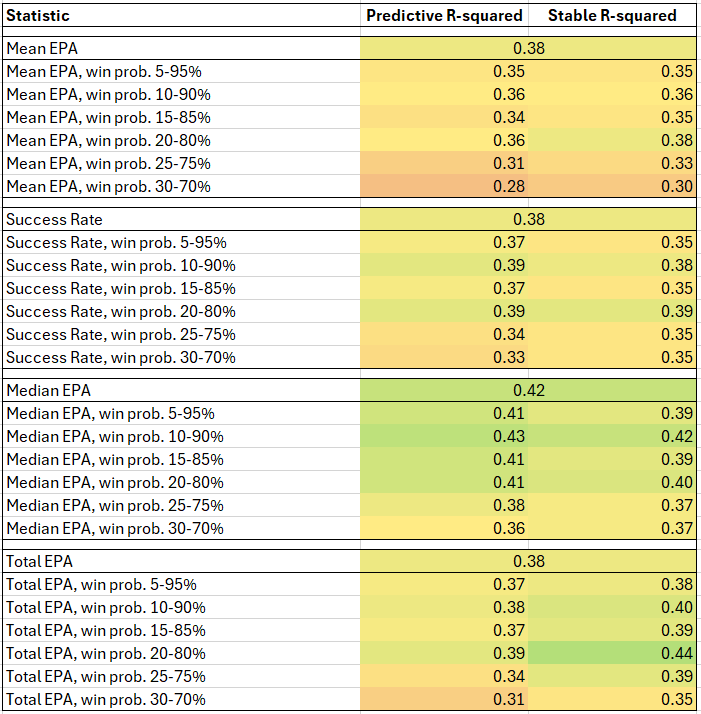
As you can see in the most green rows, mean EPA and success rate did not benefit from the garbage time filters. However, there seems to be a slight signal in favor of a 10-90% win probability cutoff imposed on median EPA and a 20-80% win probability cutoff imposed on total EPA. To investigate this further, I looked at how each of these two statistics fair depending on the sample size of snaps that they come from. That is, do the benefits of filtering out garbage time hold up when quarterbacks play more and more snaps in a season? Since we are trying to maximize predictive ability, we want to make sure that our chosen statistics have relatively high R-squared values for different potential groupings of quarterbacks, whether we are looking at everyone who started at least a few games or just those who stayed healthy for a full season. Here are the results of that analysis:
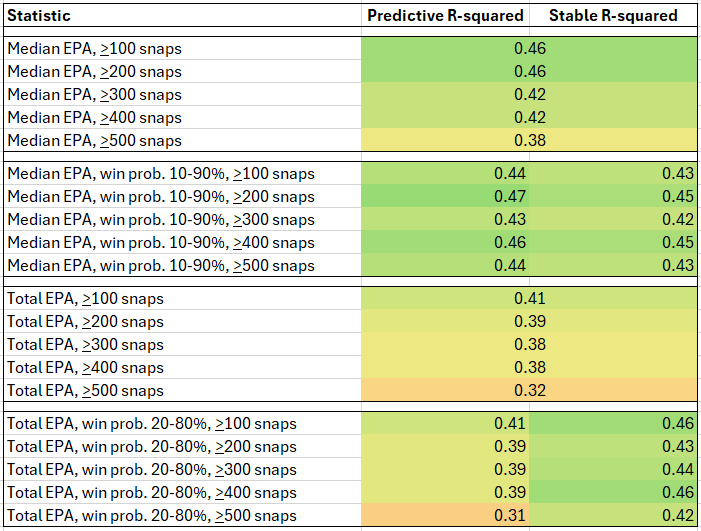
What we see is that raw median EPA and raw total EPA work best with lots and lots of quarterbacks, even if they didn’t play many snaps in a season. Once you start narrowing it down to the starters who played 500+ snaps, their correlations become markedly weaker. However, if you impose the aforementioned win probability cutoffs, those same statistics perform just as well in predicting the raw statistic next year, with the added benefit of being considerably more stable across any snap count from year to year.
The conclusion is this: if you’re going to look at any two basic QB statistics to evaluate their performance in a season and how it projects to their production next year, use median EPA over snaps played within 10-90% win probability and total EPA over snaps played within 20-80% win probability. Looking at these more thoughtfully constructed statistics rather than, say, average EPA across every snap, will help us generate more accurate expectations for QB performance in upcoming seasons.
And that’s exactly what I’ve done for 2023 quarterbacks on the plot below:
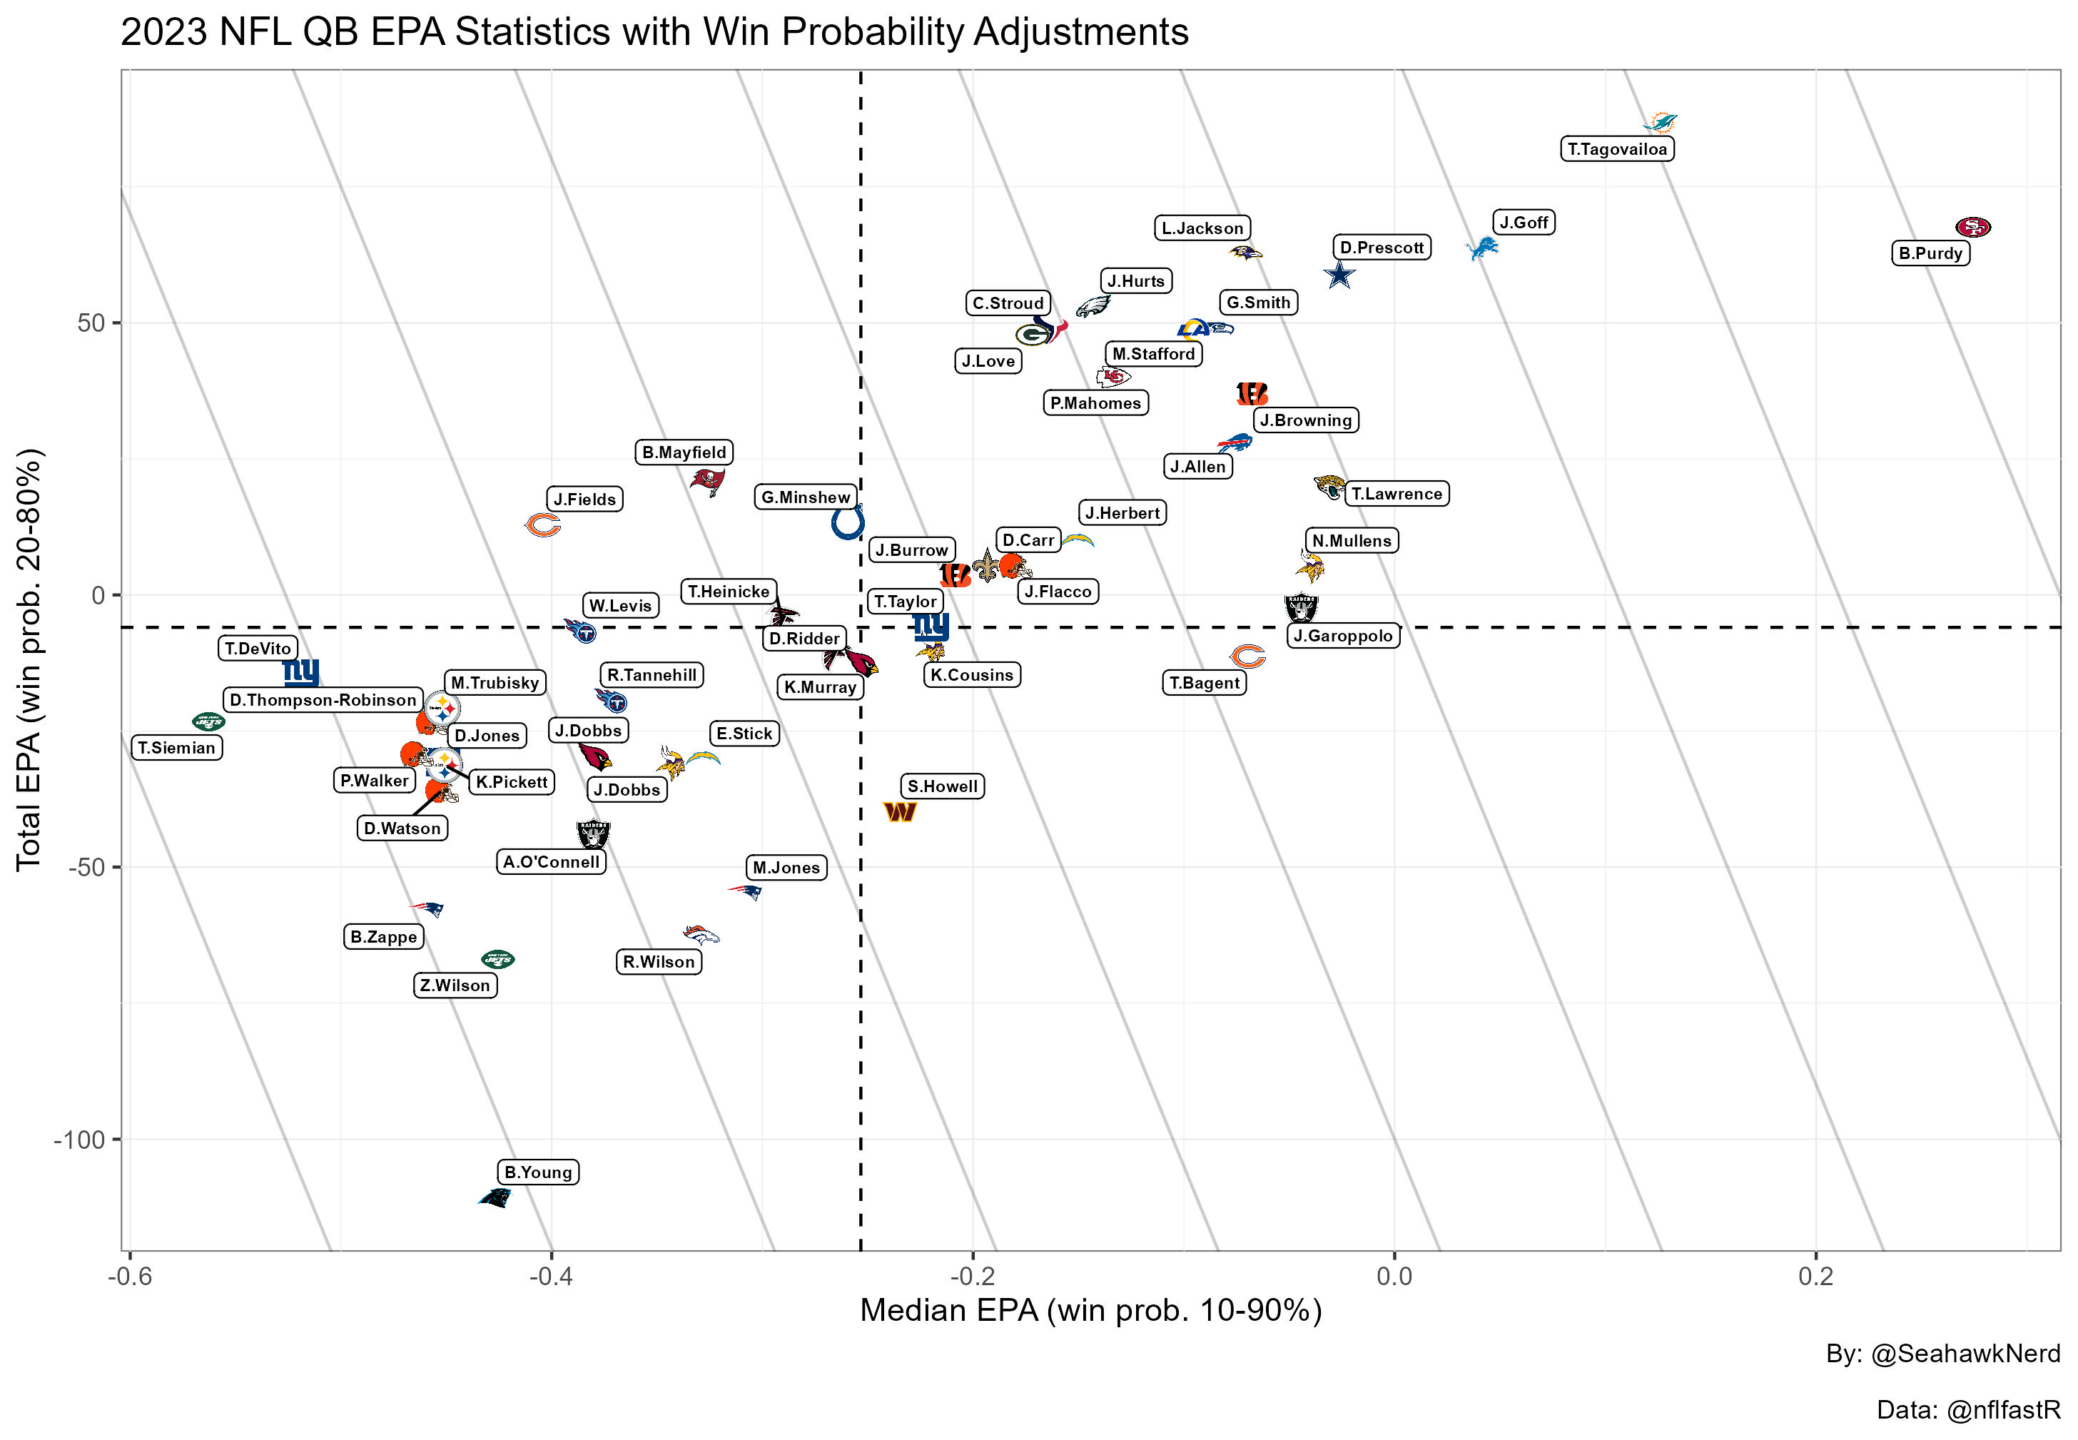
A few names stand out right off the bat: Brock Purdy and Tua Tagovailoa had excellent seasons operating Shanahan tree offenses, Jared Goff has been born again with the Lions, and Dak Prescott had a career year throwing to CeeDee Lamb.
You don’t have to look much further to find Geno Smith’s name tucked between Lamar Jackson and Matthew Stafford, two highly regarded quarterbacks that each had over 4000 yards from scrimmage in 2023. Look some more and you’ll see Geno Smith even had better EPA statistics than other hot QB names Josh Allen, Patrick Mahomes, C.J. Stroud, and Jordan Love. It’s even more impressive when you consider the fact that Geno actually ranked higher in total EPA, despite missing two games in the regular season.
If you thought Geno Smith was a tier below any of those guys, think again. He firmly belongs in the list of players who not only can win their city a Super Bowl, but can do so as the focal point of the offense. As far as 2024 goes, I think the data suggests it’s fair to expect a top 10 season from Geno, which would certainly outperform current projections which have the Seahawks near the bottom of the NFC with a losing record. For crying out loud, FanDuel currently lists Geno Smith at the same odds for Offensive Player of the Year as Devin Singletary, Evan Engram, and Jerry Jeudy. The Seahawks QB is still being slept on, and I for one can’t wait to see him prove the doubters wrong for a third straight year.